Space & data - koppenstrasse Berlin

An independently developed business-intelligence system for a Berlin short-term rental, bringing together booking behaviour, financial performance and predictive modelling.
Working as both business operator and analyst, I developed the project from the initial questions through data preparation, SQL modelling and machine learning to an interactive dashboard.
01 — The Business Challenge
How far ahead do guests book? When should prices be set? And how much of the income remains once the costs of running the business are accounted for?
I have been running a short-term rental in Berlin’s Koppenstraße since 2018. Like many small-business operators, I initially monitored its finances through spreadsheets, comparing income with expenditure. The booking platform provided useful reports, but answering broader questions meant bringing booking activity, seasonal patterns and operating costs together.
In 2024 and 2025, I completed intensive training in data analytics at BrainStation and Le Wagon, including SQL, Python, machine learning and data visualisation. Building on an existing interest in economics, I wanted to apply these methods to a business whose operations and decisions I understood first-hand.
The rental provided a substantial source of real operational data. It also put me in an unusual position: I was simultaneously the client defining the questions and the analyst developing the solution.
What began as a retrospective analysis developed into something more ambitious. Rather than producing a fixed report, I built a dashboard that could incorporate fresh booking data and provide an ongoing view of the business. Its scope expanded from booking patterns to costs, margins and overall performance, followed by a predictive component for exploring occupancy and income scenarios.
03 — THE PIPELINE
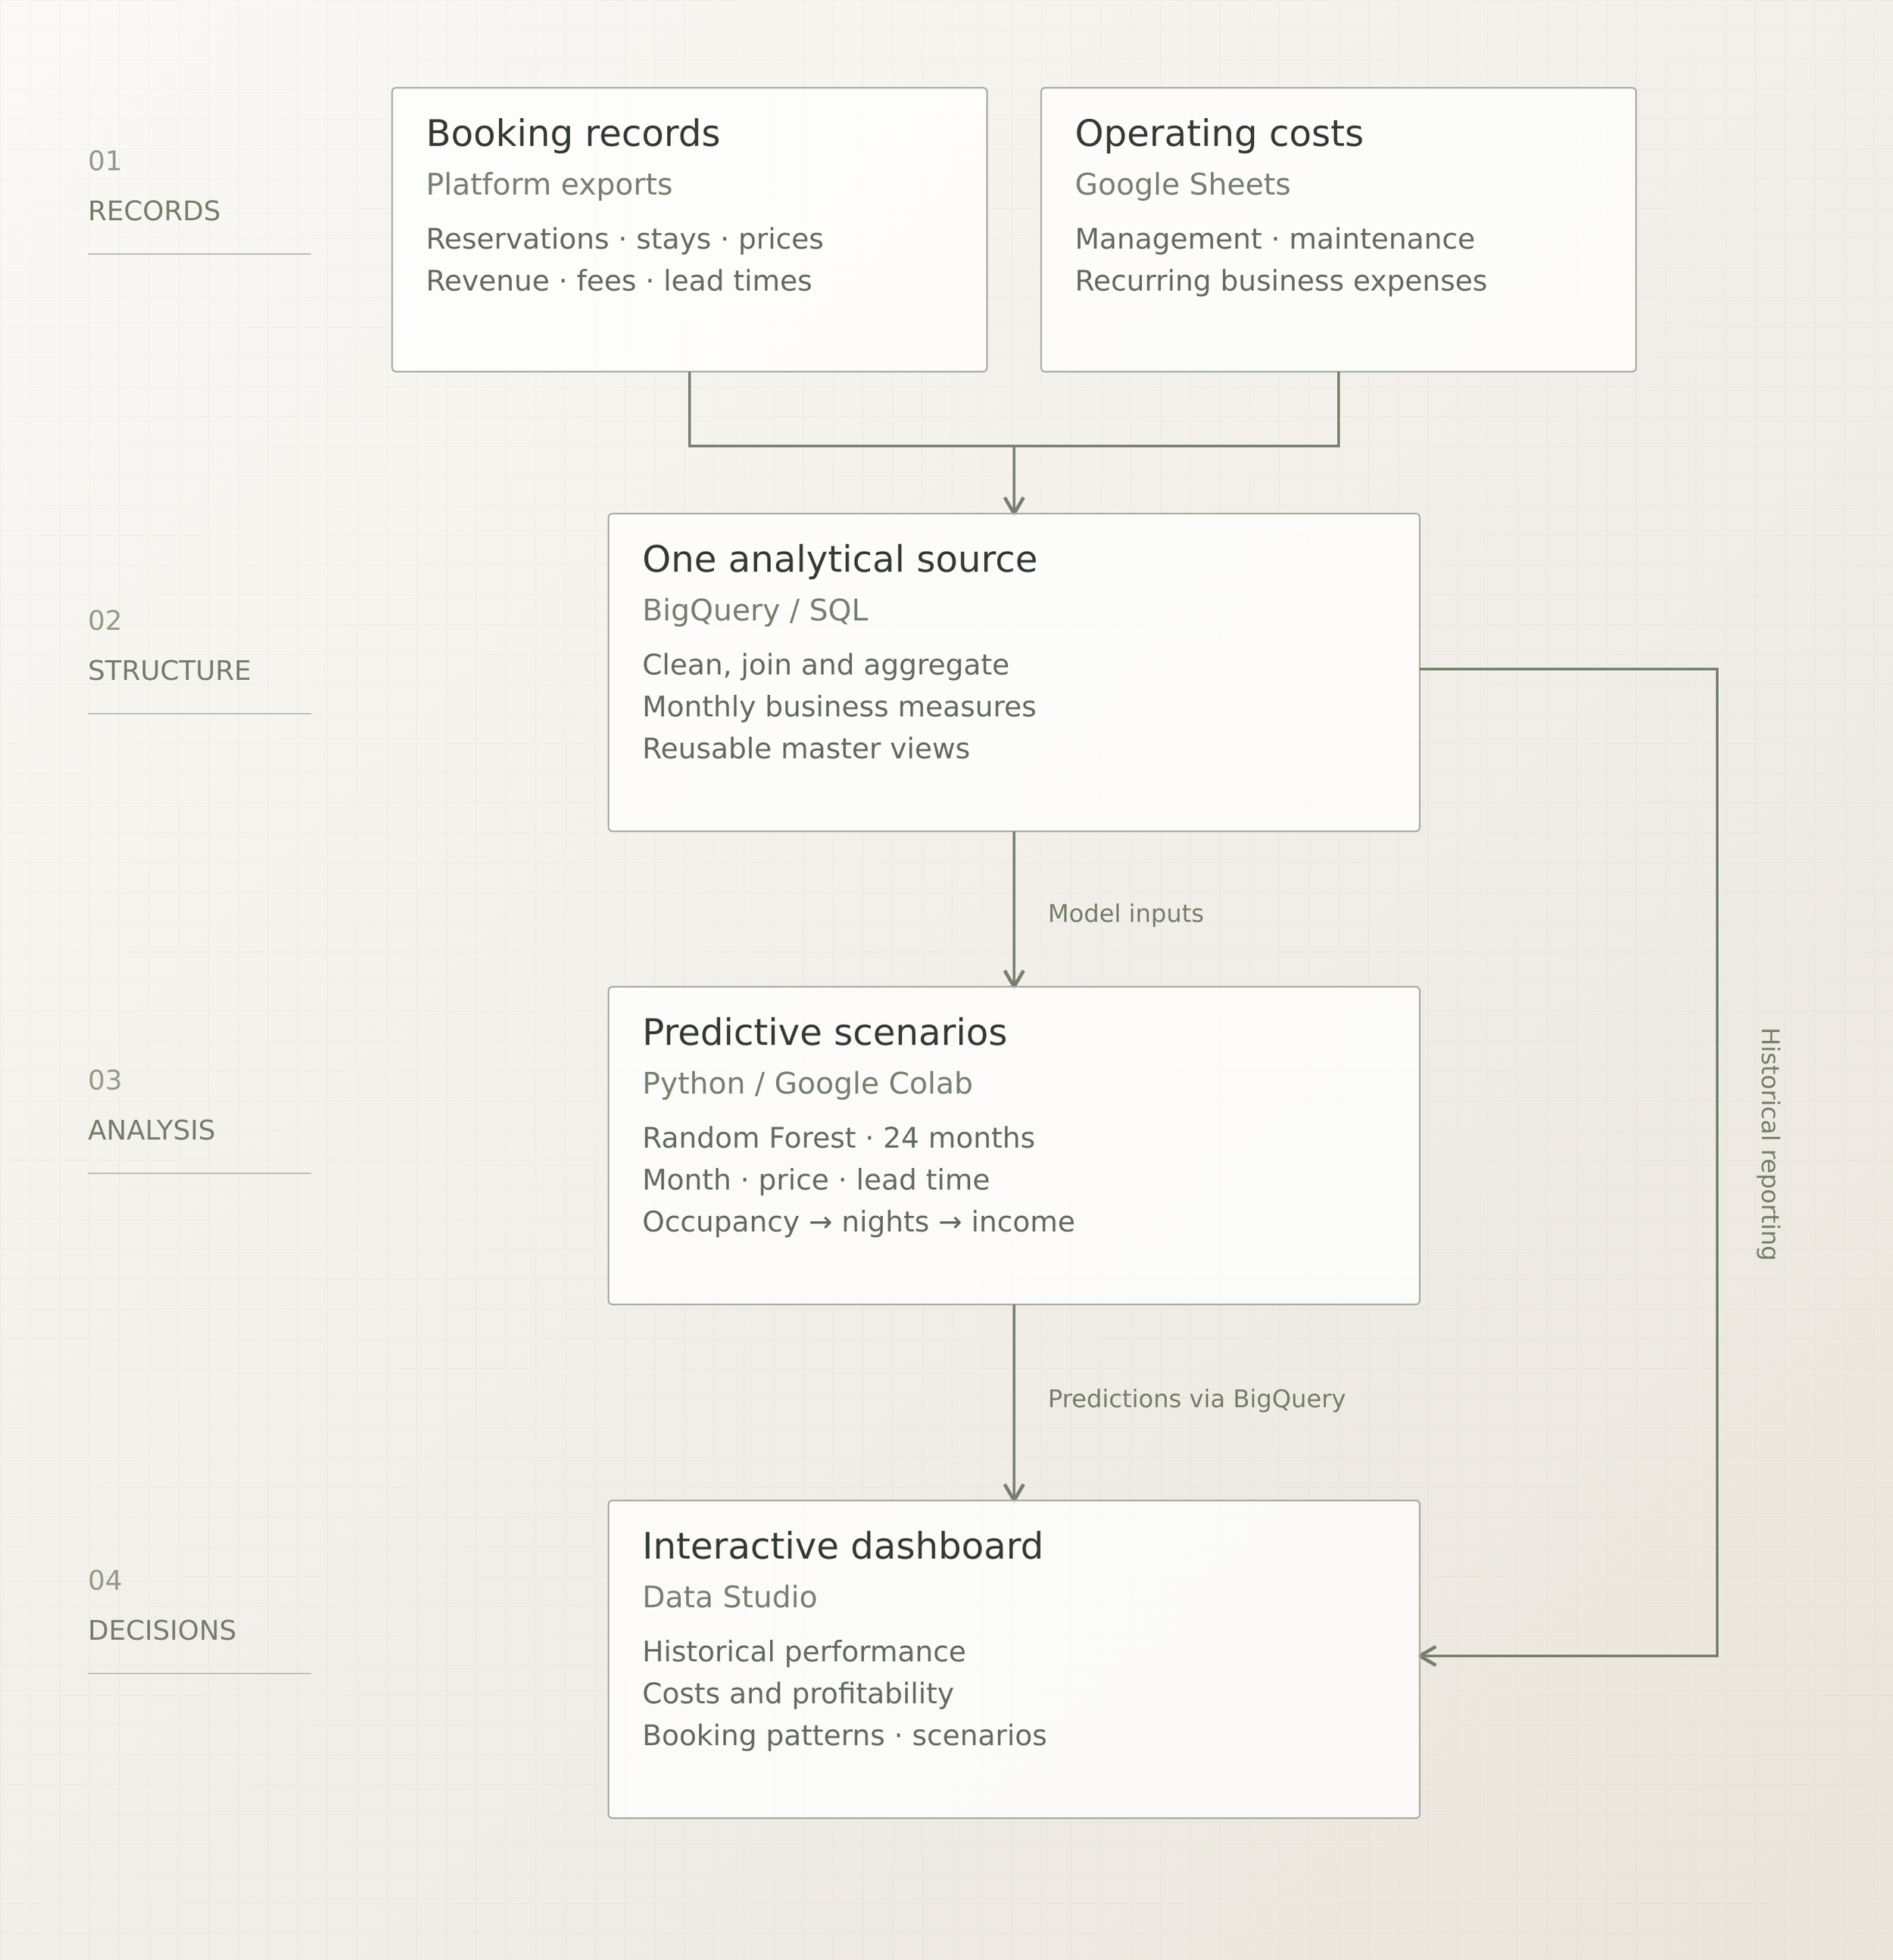
I developed a workflow using Google Sheets, BigQuery, Python and Data Studio, with each handling a distinct part of the process.
Google Sheets — preparing the source data
Booking exports and operating-cost records were organised and checked in spreadsheets, providing a manageable starting point for maintaining the underlying information.
BigQuery and SQL — building the analytical structure
SQL queries transformed booking records into usable measures and monthly summaries. I joined booking activity, revenue components and operating expenses into a consolidated view, creating a consistent source for the dashboard and subsequent modelling.
Python — developing the predictive component
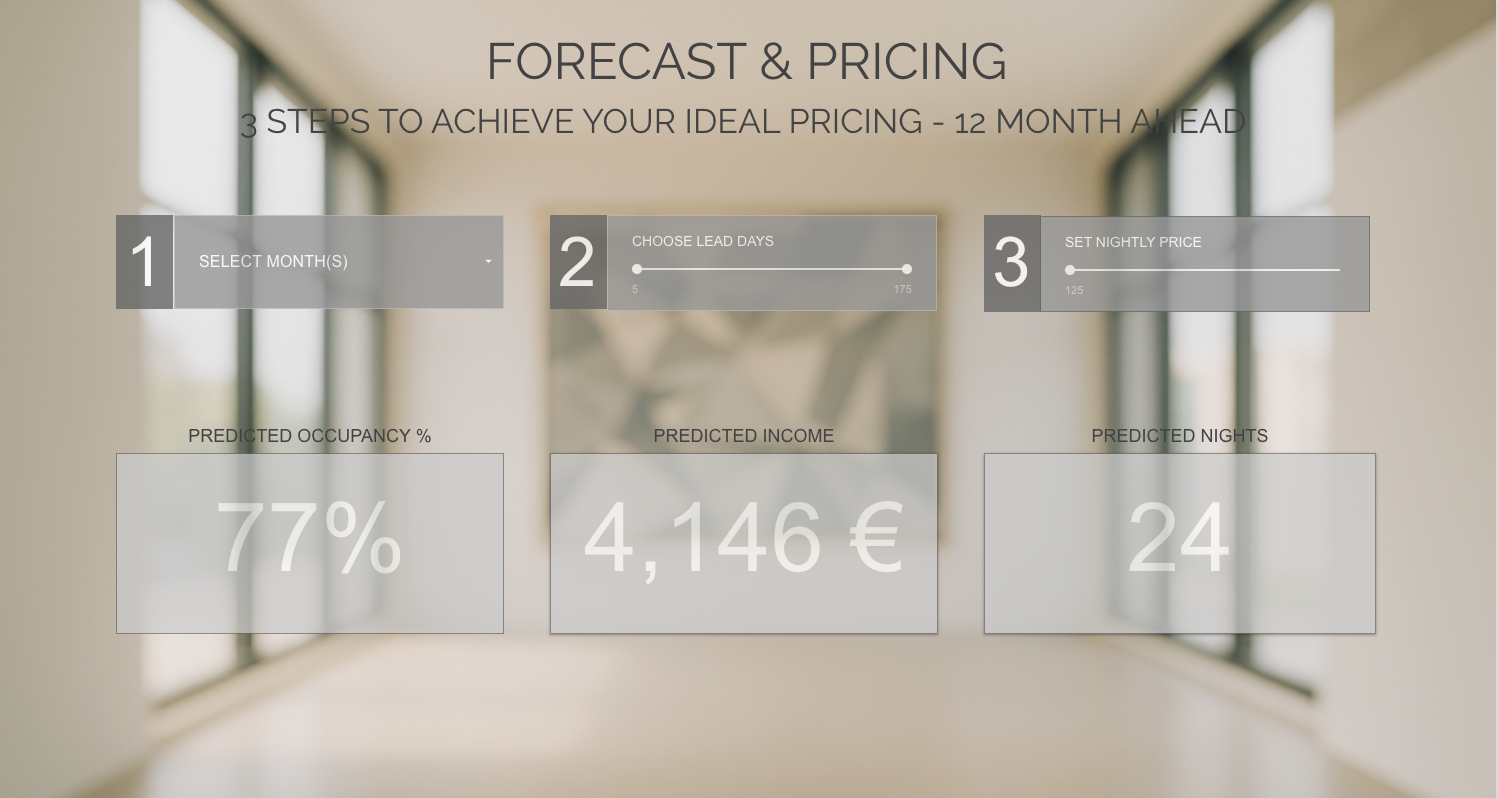
Working in Google Colab, I used the prepared historical data to train a Random Forest regression model and generate occupancy estimates across combinations of month, nightly price and booking lead time.
Data Studio — communicating the results
The dashboard brings together the prepared business data and model outputs through interactive charts, heatmaps, financial summaries and scenario controls.
Reusable SQL views reduce the need to repeat the same transformations whenever the source data is updated. The result is a partly automated workflow that can be maintained and extended beyond the original analysis.
04 — ANALYSIS & FORECASTING
The exploratory analysis focused on how seasonality, price and booking lead time relate to the performance of the rental.
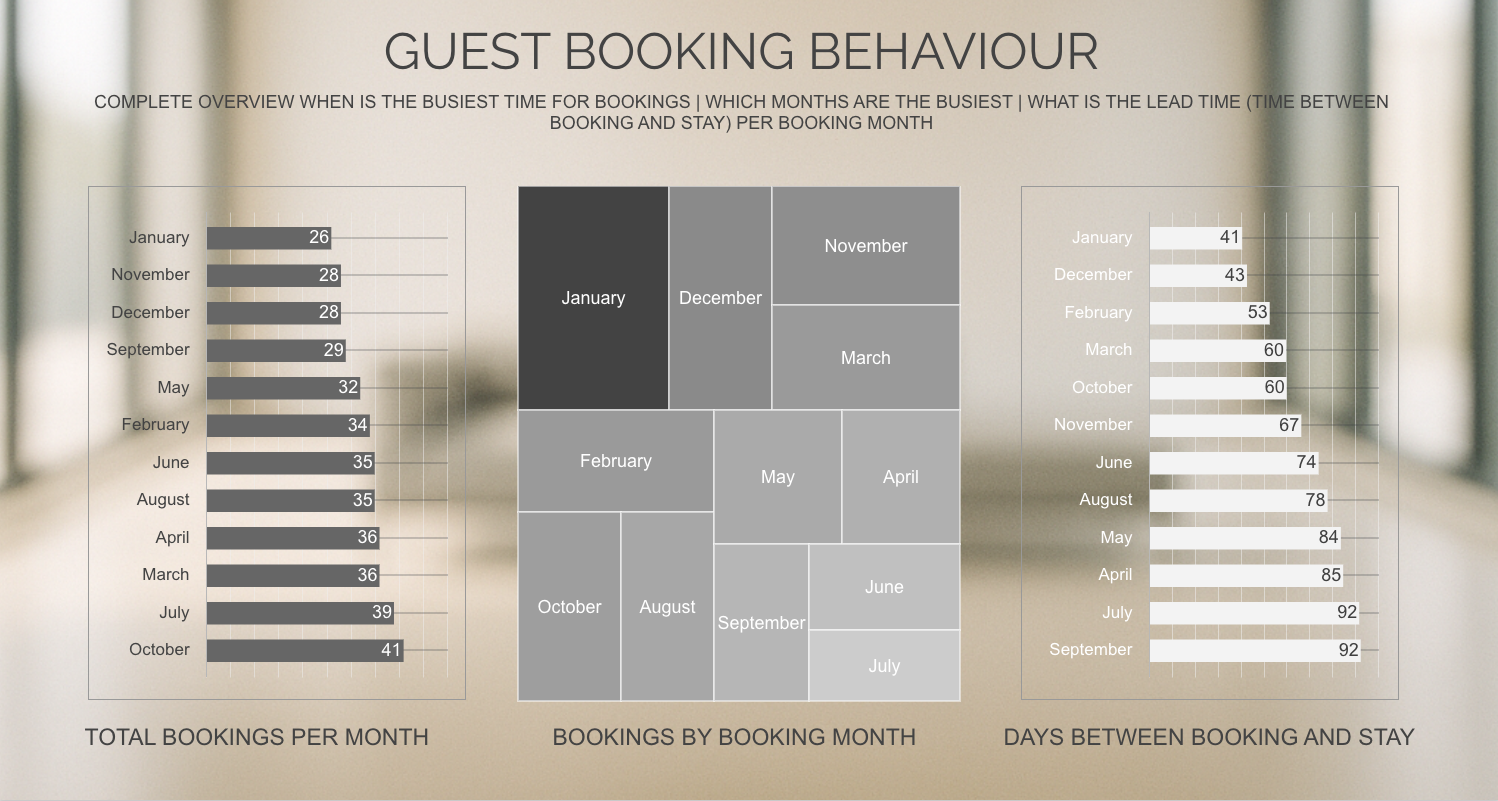
I examined the distribution of reservations across booking and stay months, changes in nightly prices, occupancy patterns and the relationship between income and operating costs. Treemaps were particularly useful for making the timing of bookings visible: a monthly revenue total alone cannot explain when guests made their decisions.
I then developed a Random Forest regression model in Python to explore these relationships further. Using a 24-month historical training period, the model estimates occupancy from three inputs: month of the year, average nightly price and average booking lead time.
I generated scenarios across a twelve-month horizon, allowing different price and lead-time assumptions to be compared. Projected booked nights and accommodation income are calculated from the occupancy estimates.
Choosing the training period was an important part of developing the model. During testing, the projected figures appeared implausibly low. I traced the problem to the Python script using the entire historical dataset, including the COVID period, when prices and trading conditions were substantially different.
I corrected the script to use the preceding 24 months of data. This experience reinforced the importance of checking model outputs against operational knowledge and examining whether the underlying data represents the conditions being modelled.
Limitations of use:
This component provides a way to investigate possible outcomes rather than a guaranteed forecast or an automatic pricing recommendation. It reflects relationships within one property’s historical data; the value is in making assumptions explicit and allowing them to be examined alongside the observed performance of the business.
06 — BUSINESS INSIGHTS & DECISIONS
The most consequential finding concerned booking lead time.
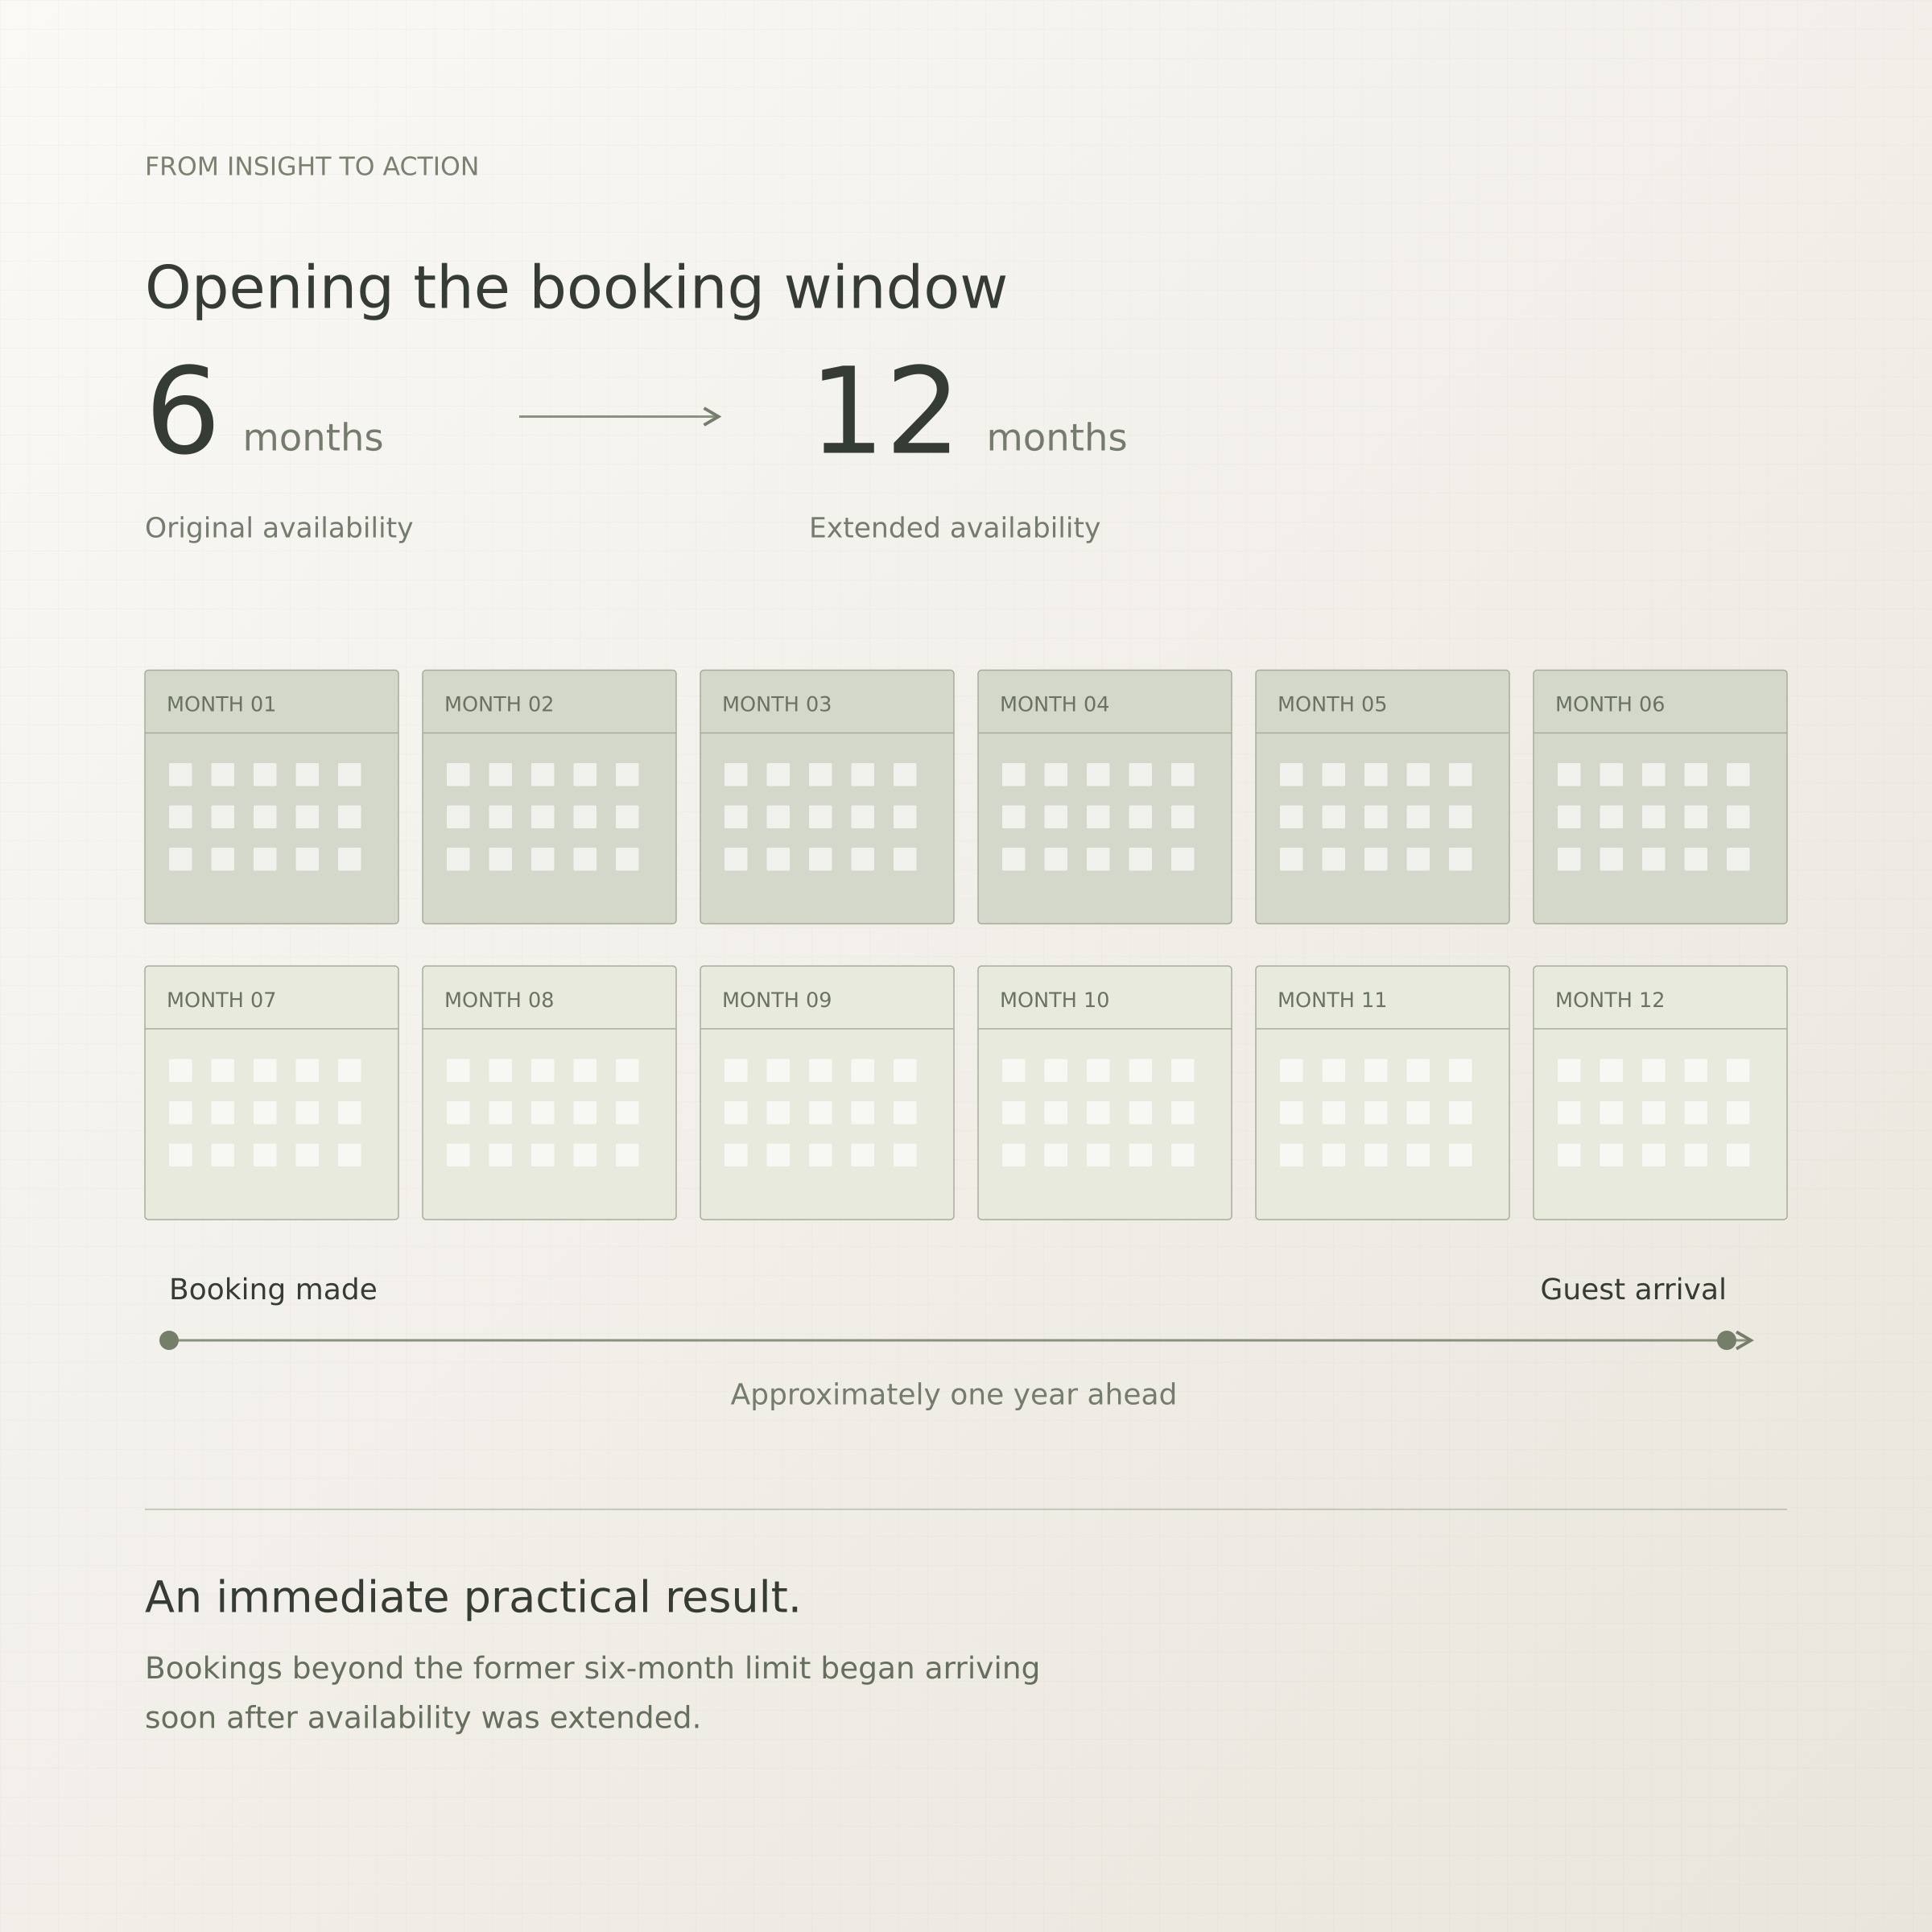
I had limited the property’s availability window to six months. During the weeks I was developing the dashboard, I received at least five enquiries from guests wanting to book beyond that window. When the visualisation showed summer reservations clustering at the six-month boundary, the connection became clear: the availability setting was restricting demand that I had not been aware of before the analysis.
I extended the window to twelve months, and bookings for dates beyond the previous limit began arriving almost immediately. One of the earliest was made approximately a full year before the stay.
This changed how I approached summer pricing and availability. I could publish my intended rates much earlier and give guests more time to book, making planning less reactive. It also helped attract more families organising holidays well in advance—a guest profile that, in my experience of running the property, has generally taken good care of it.
The analysis also identified January as the busiest month for making reservations within the historical dataset. This gave me a practical reason to review future availability and pricing before that period. My interpretation is that some guests are looking ahead to holidays during the winter, although the booking records themselves cannot establish their motivation.

02 — The Data
The project combines historical booking records, primarily from Airbnb, with separately maintained operating costs.
Booking records provide information about reservation dates, arrival and departure dates, length of stay, nightly prices, income and platform fees. From these, I derived measures including booking lead time, monthly occupancy, average nightly price and booking volume.
A crucial distinction was between when a reservation was made and when the guest stayed. These describe different aspects of the business: one reveals purchasing behaviour, while the other shows how demand and income are distributed throughout the year.
I added recurring expenses, management costs, repairs and maintenance to develop a fuller financial picture using profit margins.
Bringing these sources together turned separate booking and expense records into a consistent basis for analysing both guest behaviour and business performance.
05 — DASHBOARD & UX DESIGN
Making the analysis usable required a separate process of interface development.
My first dashboard followed many of the conventions I had encountered during training. It was functional, but I wanted greater clarity, stronger visual hierarchy and a more considered experience.
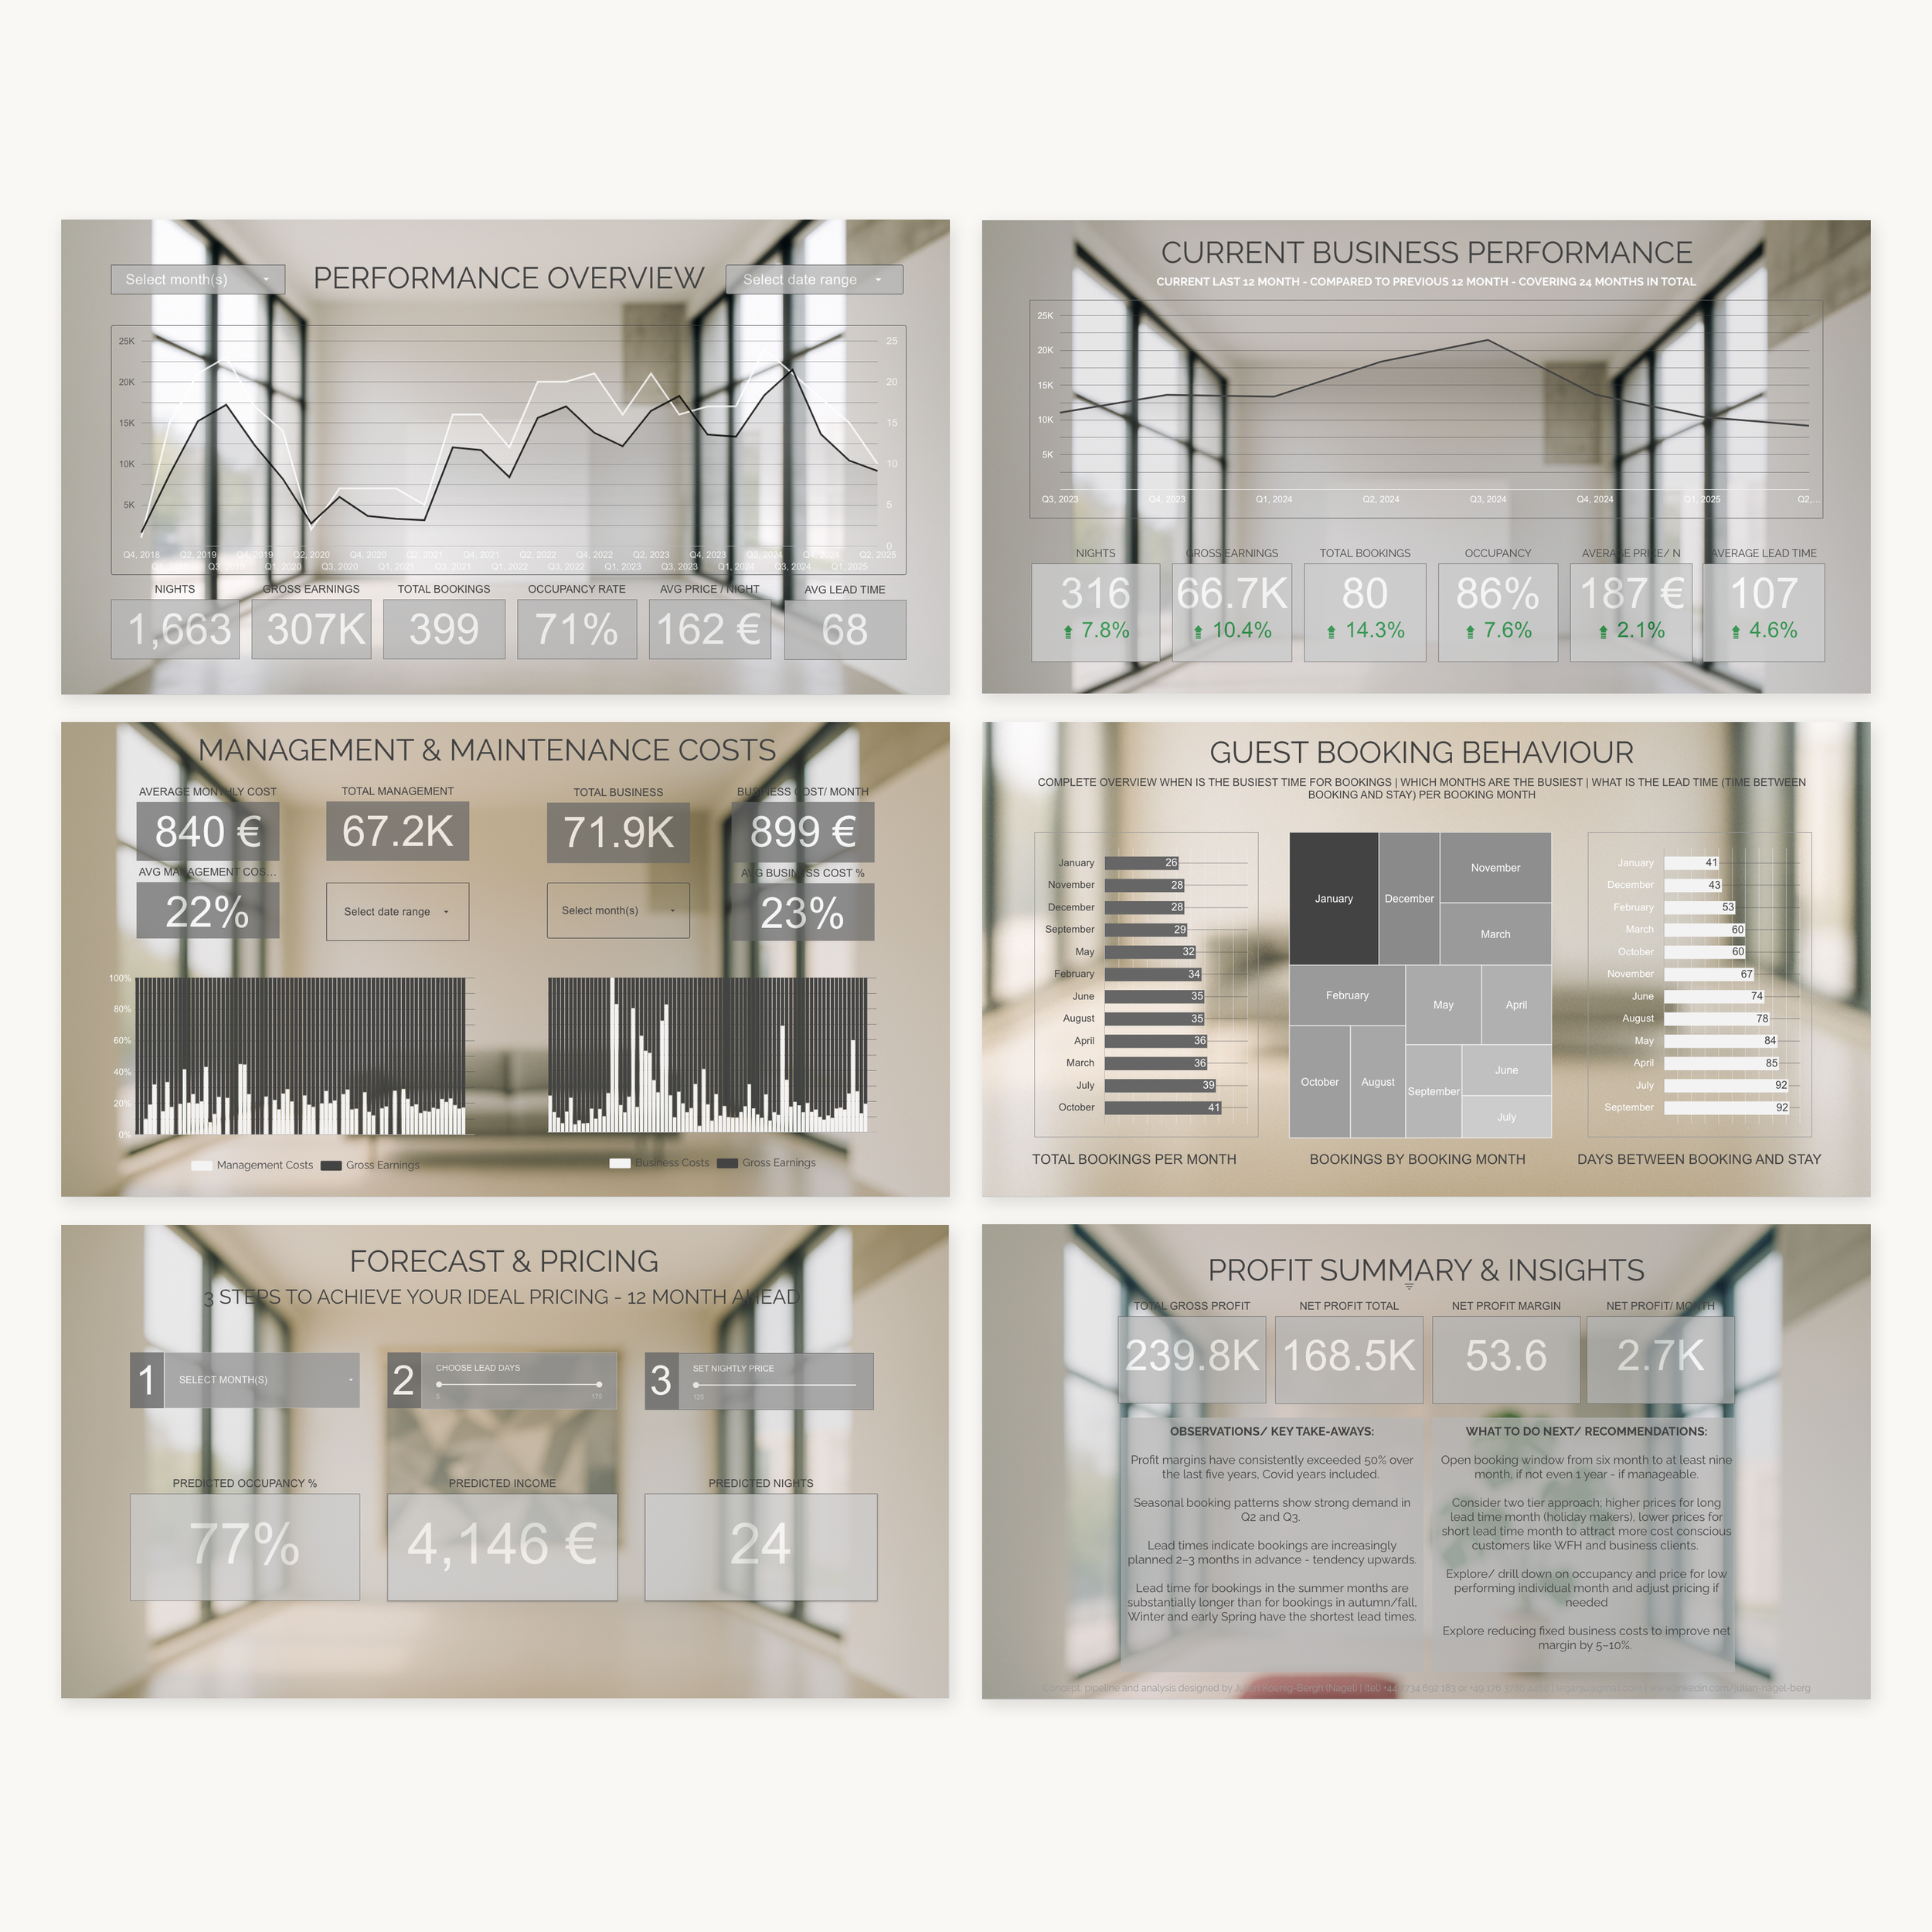
Working within the constraints of the free version of Data Studio, I redesigned the interface twice. The aim was to create something precise, approachable and confident, with enough visual character to invite exploration while keeping the information easy to read.
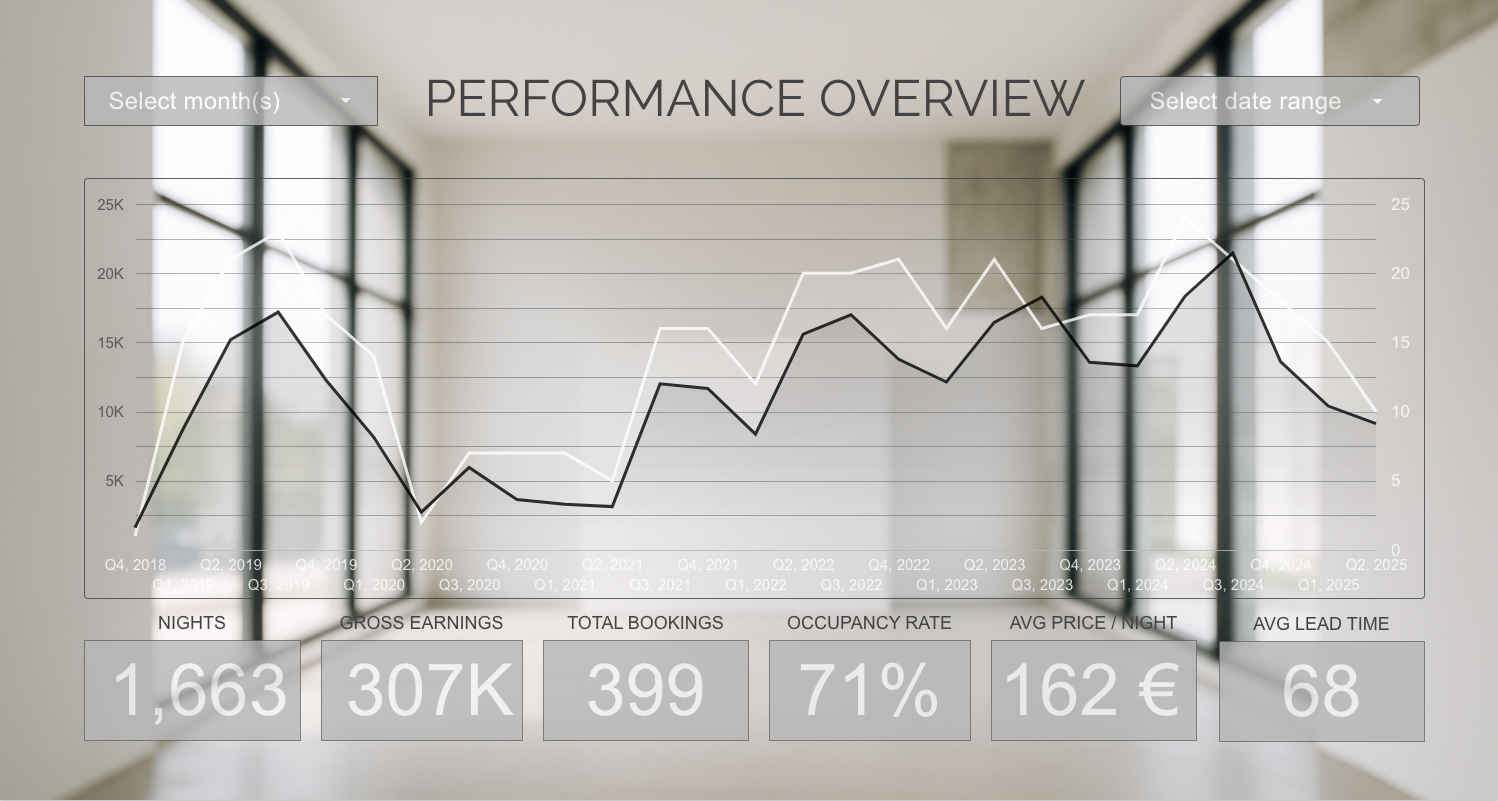
I used a restrained palette, a consistent two-tone approach and unobtrusive colour combinations. Spacing and hierarchy help distinguish headline measures from supporting detail, while different chart types address different questions: heatmaps reveal booking patterns, time-series charts show change, and financial breakdowns explain the relationship between income and expenditure.
Restraint also shaped the selection of information. Deciding which measures deserved prominence—and which added little to a particular view—was as important as their graphic treatment.
The resulting dashboard supports both a quick assessment of performance and a more detailed investigation of the underlying patterns.